Introduction
Our project focuses on video games and predicting the amount of success that they have. We used the factors of genre, year of release, platform, publisher and rating scores/counts from critics/players in order to predict how good a game would be. We defined how good a game is as the total global sales.
Importance
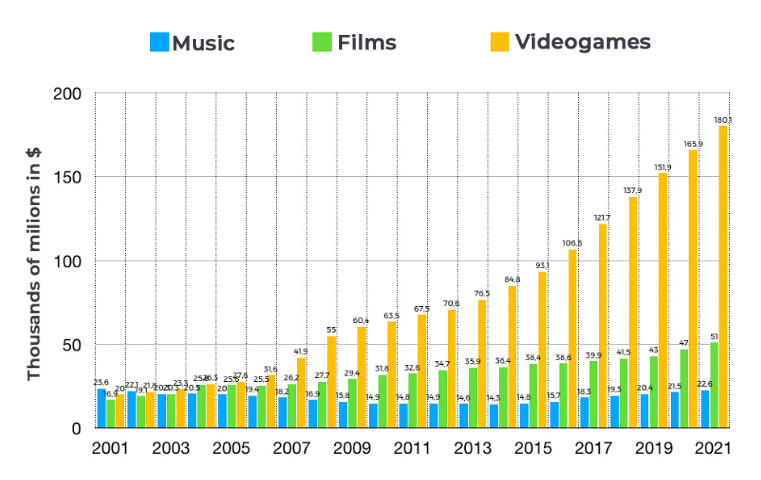
Gaming has already become a massive industry that not only competes with how much other industries such as movies and music, but even have more money put into the industry. Furthermore, if current trends continue as projected, they will grow even more as can be seen in the figure below.
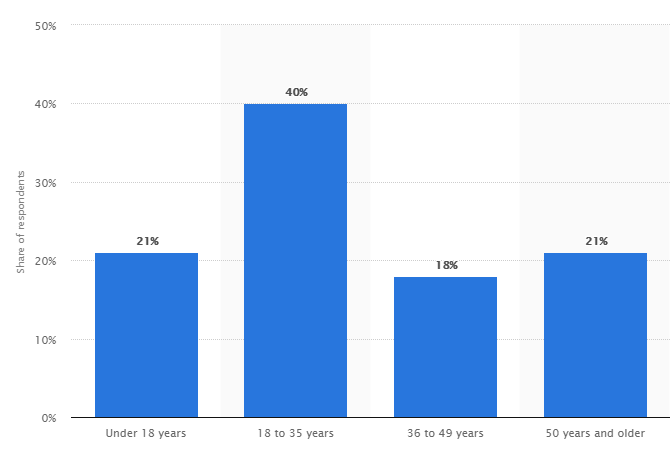
Although we can clearly see that gaming is a growing industry from the graph that is seen above, there are also other indicators that gaming will be an industry that continues to grow: in particualar, who plays games.
As can be seen from the above, it is very clear that gamers very much skew towards a younger audience. As with any industry, it is highly likely that people who are young and gaming, will continue to game and continue to contribute to the growth of the industry.
Dataset
The dataset that we used was from kaggle. Both the full dataset as well as the training and test sets that we used can be found on our github repository.
Characteristics of the data
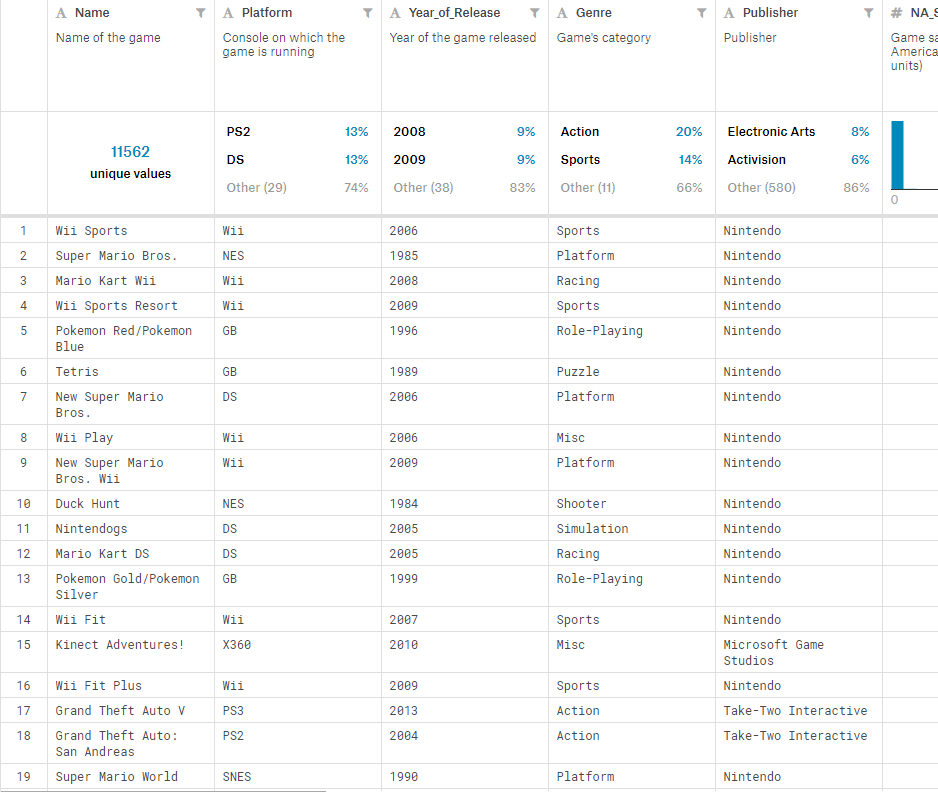
There were a total of 16720 games in the dataset from 1980 to 2020. The features include metrics such as genre, year of release, platform, publisher, scores by critics and users, as well as some that we did not use such as sales in various regions, etc. (Note that only games that were released before 2016 had any sales numbers.)
We did not use this entire dataset but picked out 6204 games for as training data set and 690 games as test data set.
Approach
In this project, we will use supervised learning because we want to use features of games as an input to predict its global sales as an output from the dataset above as the training dataset.
We will use mutiple regression as the approach to find out the pattern and predict the values of the rating on additional unlabeled data because there are eight independent variables: Platform, Year_of_Release, Genre, Publisher, Critic_Score, Critic_Count, User_Score, User_Count, and we want to determine the degree to which these independent variales are influencing the global sales, the dependent variable.
Steps:
- Perform One-hot Encoding on dataset
- Examine different regression models
- Linear regression
- Ridge regression
- Lasso regression
- Elastic net regression
- Perform Cross Validation on each model
What is new?
For the categorical variables, we apply one-hot encoding using pandas library to make them usable in our models.
We also used different kinds of linear model such as ridge regression, lasso regression and elastic net regression to train and test our data set. Also we applied cross validation through scikit-learn library to get best alpha value for different models.
Data Preprocessing
Data Cleaning
We deleted all data points with null or invalid values manually to avoid errors during data analysis.
One-hot Encoding
There are 4 CONTINUOUS VARIABLES in the dataset: Critic_Score, Critic_Count, User_Score, User_Count
There are 4 CATEGORICAL VARIABLES in the dataset: Platform, Year_of_Release, Genre, Publisher
We use one-hot encoding to convert categorical data into integer data because the regression model we intend to use in our project requires numerical values.
Using Genre as an example to perform one-hot encoding:
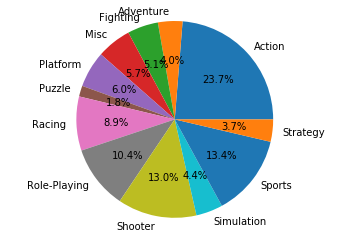
We discover that there are 12 genres which is finite, and we will represent each genre as a binary vector. Each vector will have a length of 12 for the 12 possible values.
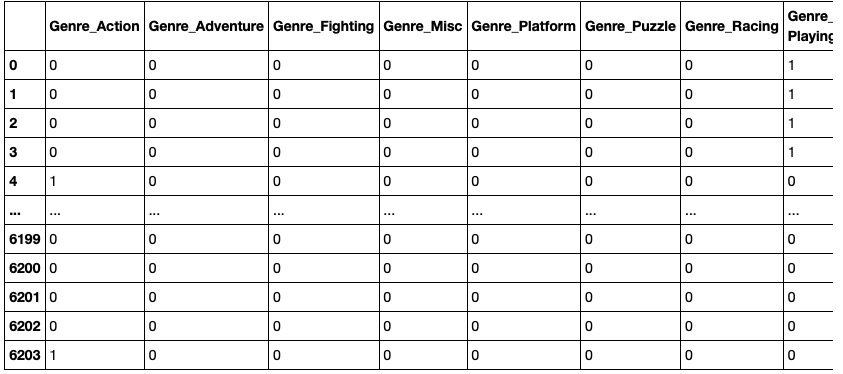
We perform One-Hot Encoding for all four categorical features as exemplified above with the Genre feature and convert them into binary values so that we can apply them to different regression models.
Different Regression Models
We will perform linear regression, ridge regression, lasso regression and elastic net regression and compare their R^2 score and RMSE to find the optimal model.
Linear Regression

Ridge Regression

Lasso Regression

Elastic Net Regression

Cross Validations for Different Models

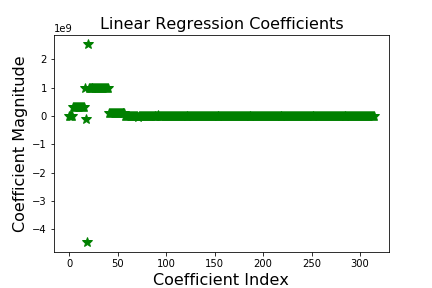
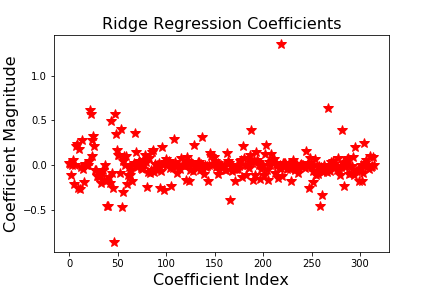
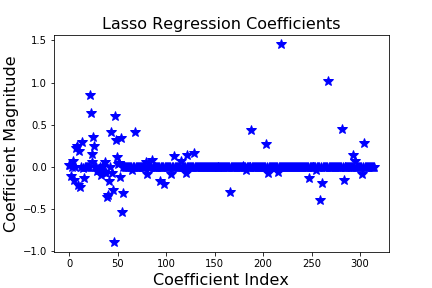
Based on the coefficients graphs for linear, ridge, and lasso regression after cross validation, we can see that the range of coefficient magnitude is smallest for ridge regression and highest for linear regression. This indicates that the ridge regression is the optimal regression model to predict the data we want. While performing lasso and ridge regression with cross validation, the best alpha value to choose were 0.6 and 10, respectively. Those alpha values were the third component of the alpha values we used. If we look at the table above, we can see that “genre” is the feature that the third coefficient is representing. Based on these results, we can say that in order to get the best prediction of global sales of a game, we can use the ridge regression model with the relationship between genre of the game and global sales of the game.
Conclusion
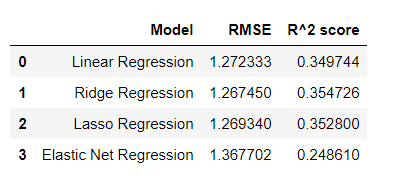
Ridge regression was the best for this dataset out of linear regression, lasso regression, elastic net regression, and itself with an RMSE value of 1.267450 and a r^2 value of 0.354726. While this may be the optimal model for the regressions, it is still not a strong correlation by any means as the r^2 value, at best can only indicate a weak correlation between the factors that we had used as predictors and the total global sales.
Citations
Kirubi, Rush. “Video Game Sales with Ratings.” Kaggle, 30 Dec. 2016, https://www.kaggle.com/rush4ratio/video-game-sales-with-ratings.
“The Video Games’ Industry Is Bigger Than Hollywood.” LPE Esports, https://lpesports.com/e-sports-news/the-video-games-industry-is- bigger-than-hollywood.
“U.S. Average Age of Video Gamers 2019.” Statista, https://www.statista.com/statistics/189582/age-of-us-video-game-players-since-2010/.
Contributions
- First Draft of Proposal - Kyu Han, Ting Qiu, Raffi Yang
- Editing Proposal - Raffi Yang, Cindy Zhang
- Data Collection - Ting Qiu
- Data Cleaning - Ting Qiu
- Data Preprocessing - Ting Qiu
- Supervised Learning Engineering - Ting Qiu
- Github Page Contributors - Kyu Han, Ting Qiu, Raffi Yang, Cindy Zhang
- Github Page Editor - Ting Qiu, Raffi Yang, Cindy Zhang
